Wondering if your Facebook Live videos are working? Need a deeper understanding of your live video metrics?
In this article, you’ll find a deep dive into Facebook Live video Insights in the Creator Studio dashboard. Discover which metrics actually help you improve your Facebook lives and find out why most marketers get their data and measurement wrong. Check below the entire article that Luria Petrucci wrote to Social Media Examiner.
To learn how to analyze Facebook Live video in Creator Studio, read the article below for an easy-to-follow walkthrough or watch this video:
#1: View Facebook Video Insights in Creator Studio
Facebook Live video can be an effective tool for growing your audience and creating a loyal following but you need to know if it’s helping you reach your goals specifically. Looking at your insights data will help you optimize your Facebook Live videos to help you grow your business.
First, you need to understand where you can get analytics inside the Facebook ecosystem. You don’t get any analytics on your personal profile. In groups, you get group-specific analytics like how many members you have, whether engagement is going up or down, popular days and times for activity in your group, and who your most active members are; but you won’t get much data around retention or live video views or engagement.
For your Facebook business page, though, you’ll get all of the analytics you want—and probably more than you want. Creator Studio will give you general insights about your videos, as well as detailed data about individual videos.
To access Creator Studio, go to business.facebook.com/creatorstudio. When your Creator Studio dashboard opens, you’ll see some general Facebook video insights. Click Insights on the left-hand side to start digging into more analytics and information about your videos.
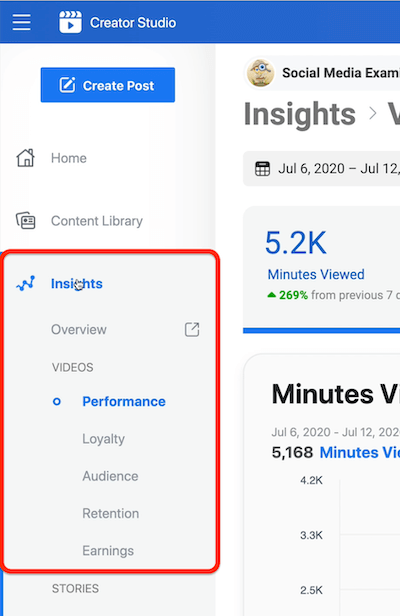
Performance Insights
The first Insights view you’ll see is about the performance of your Facebook video content in general. It will show your total minutes viewed for the last 28 days by default.
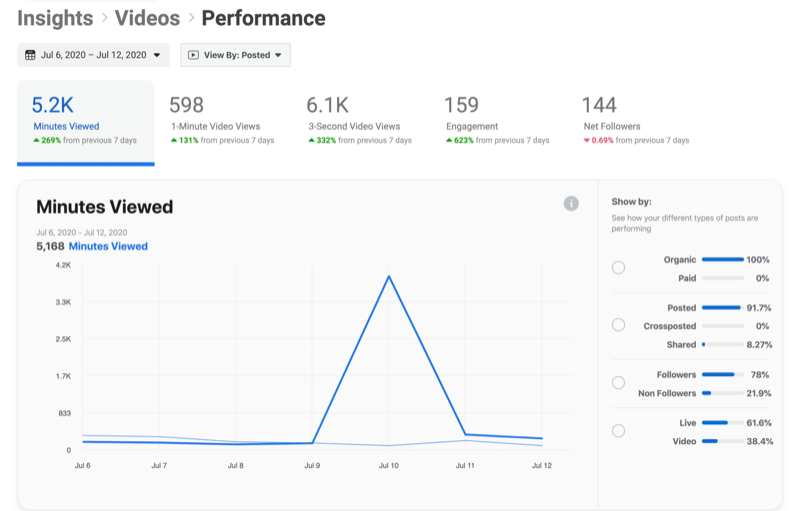
If you want to change this time period, click the date in the upper-left corner and select the last month or quarter or choose a custom date range.
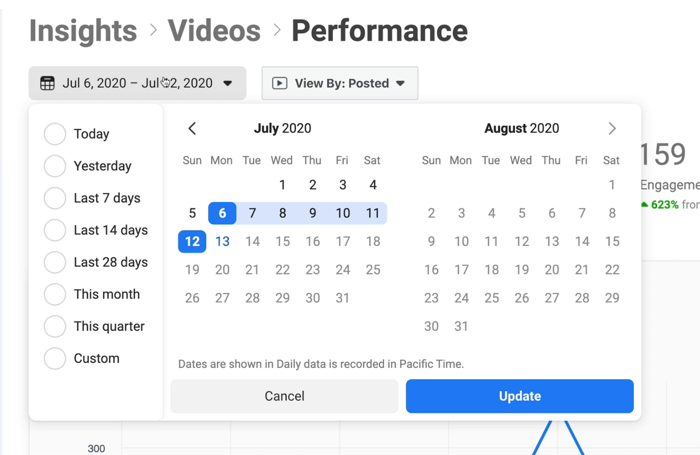
Across the top of the page, you’ll see tabs for 1-minute and 3-second video views, engagement, and net followers.
The engagement graph is super helpful because you can see at a glance whether your engagement is going up or down over time. Are people showing up? Are they not?
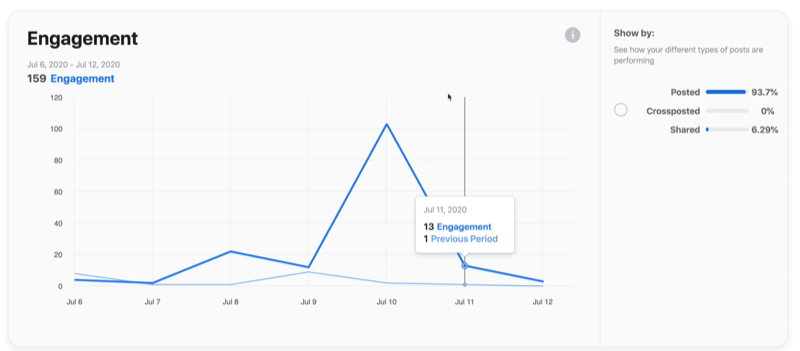
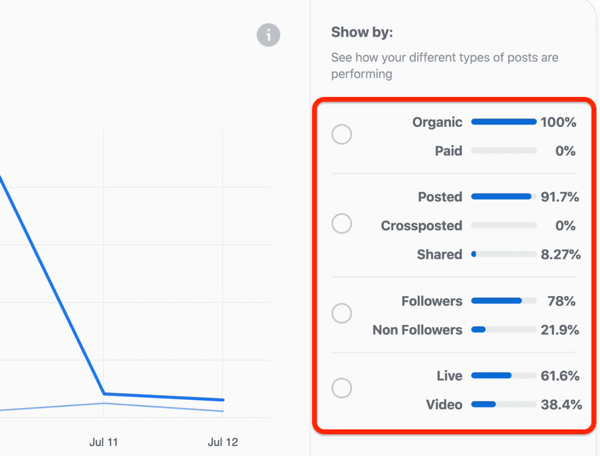
Creator Studio also lets you view these insights on a more granular level. On the right, you’ll see options to filter this data by organic vs. paid, posted vs. cross-posted or shared, followers vs. non-followers, as well as live vs. video.
Loyalty Insights
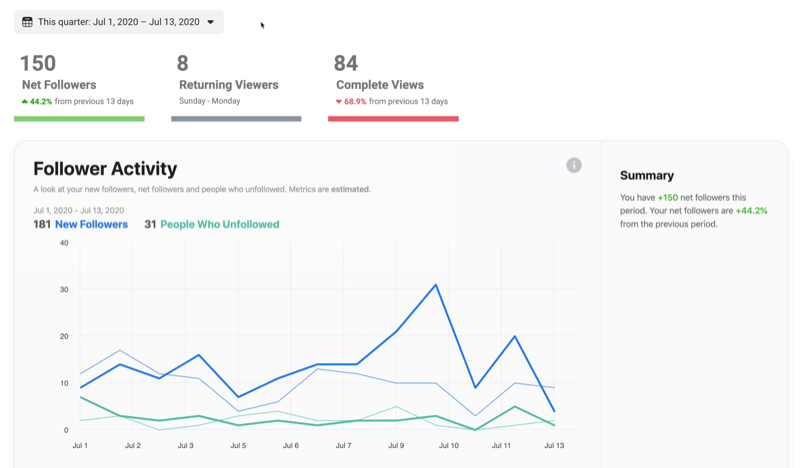
Loyalty is one of the most important assessments of your audience engagement because it will tell you if people are coming back repeatedly because they like your video content. If you click the Loyalty tab under Insights, you’ll see your net followers and complete views.
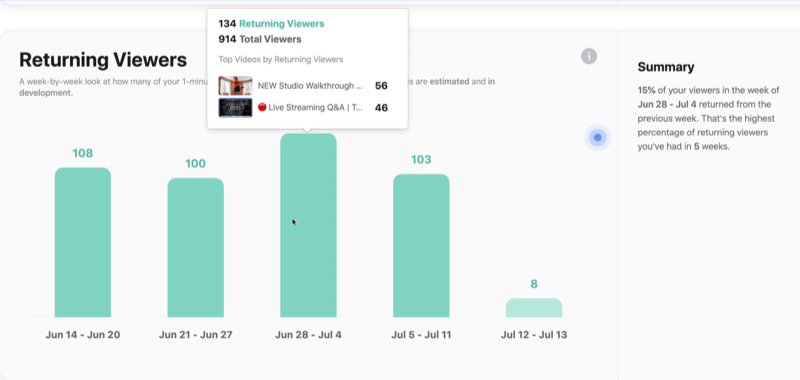
Scrolling down on the page will reveal how many returning viewers you had and which videos they returned to. This data gives you an idea of what kind of video content you should keep creating. If people aren’t returning to a piece of content you thought they’d like, guess what? You need to make some adjustments.
Audience Insights
Next up is the Audience tab, which of course gives you a lot of information about your audience. Who are your viewers? Where are they watching from?
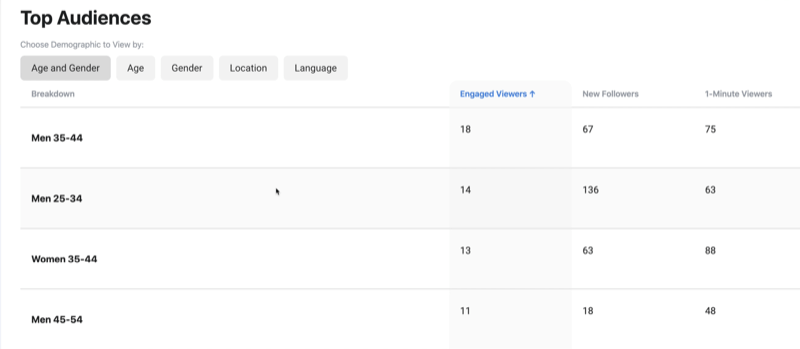
While this data won’t tell you much in terms of engagement, you can see how many engaged viewers you had in this period of time, where they’re from, what language they speak, and what their interests are.

Also look at the age and gender of your top audiences. In this case, the most engaged viewers are primarily men ages 35–44. So start targeting content to the types of people who are watching your videos.
Retention Insights
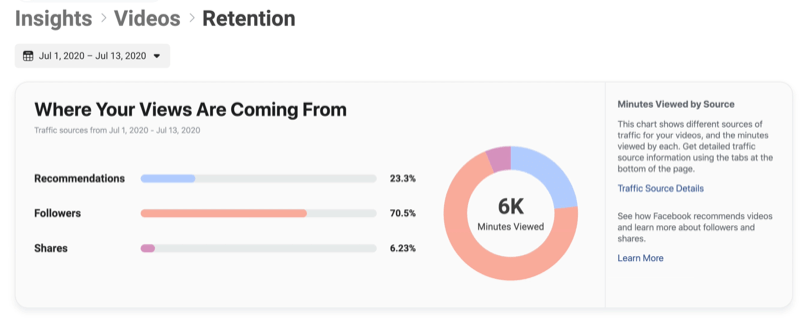
Click on the Retention tab to get a better understanding of where your video views are coming from.
Recommendations tells you if Facebook is recommending your videos after another video and reveals whether your followers are still interested in your content. You can also look at whether views are coming from shares as well.
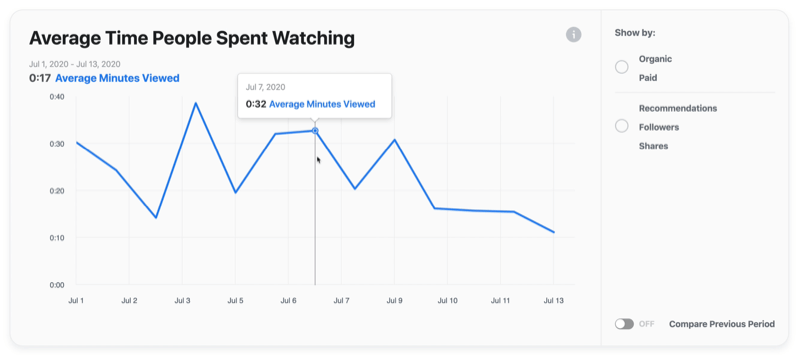
The Average Time People Spend Watching section is a tricky one to garner some information from. I’ll talk about this more in-depth in a minute.
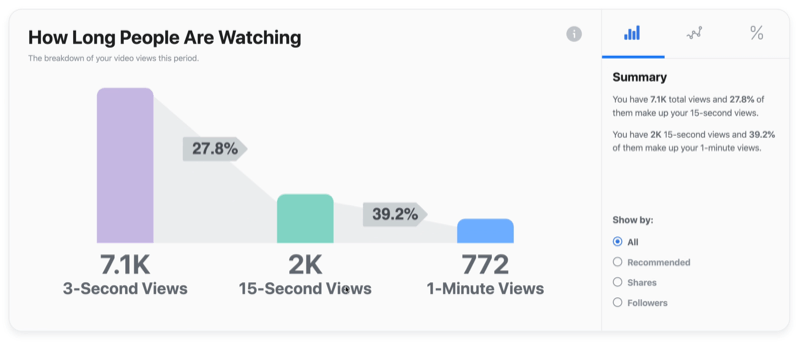
How Long People Are Watching is in the same vein as what I was just talking about. Don’t put too much pressure on yourself when it comes to these particular insights.
#2: View Insights for Individual Facebook Live Videos in Creator Studio
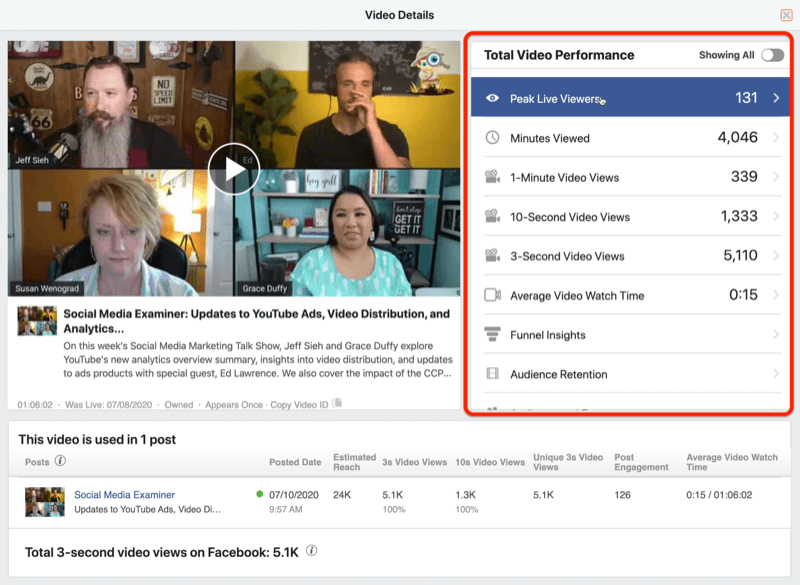
While your general insights will give you a great look at how your page is doing with all of your video content, you need to look at individual Facebook Live videos to understand how they’re performing. So find your most recent live video and click on it to see your insights.
Peak Live Viewers
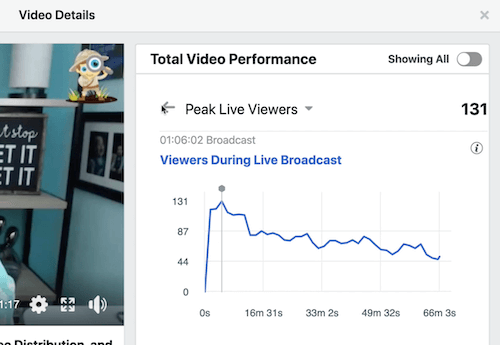
Peak Live Viewers is one of the most important metrics to pay attention to so click on it to delve into the data for your live video. Is it increasing over time? Where is your peak happening? If your peak is happening right at the top of the stream—like this one is at 4 minutes and 45 seconds—that’s unusual. Most live videos peak at about 18–20 minutes in. You can adjust your content based on this information if it’s happening consistently in your broadcasts.
Minutes Viewed and 1-Minute, 10-Second, and 3-Second Views
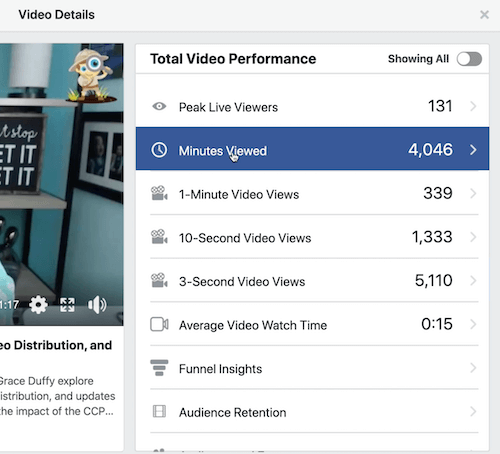
Minutes Viewed is a stat to look at over time. Is it increasing? Because of the way Facebook tracks views and the nature of Facebook being a feed, this metric is actually pretty misleading, as with a lot of the analytics you’ll see for videos. This is why you can’t look at any of your video analytics in isolation.
Let me give you an example. For 1-minute, 10-second, and 3-second video views, a lot of that is because the feed is scrolling by and that’s not going to give you an accurate description of what’s actually happening.
Average Video Watch Time
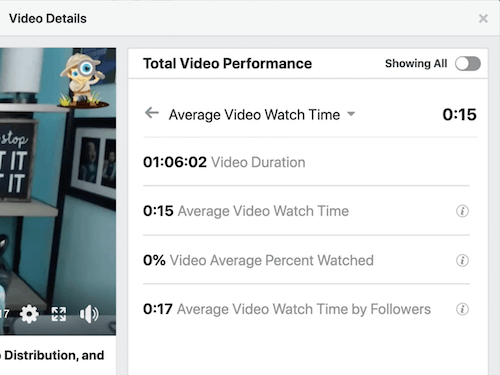
Now let’s talk about Average Video Watch Time. In the image below, you can see that people are watching, but the video average percent watched shows 0%. Well, that can’t be the case. So again, use your brain, look at everything together, and you’ll get a more accurate description of what’s happening with your Facebook Live video.
Audience Retention
Next, let’s look at Audience Retention for individual videos. This graph will give you an indication of how long you’re keeping people watching your live video in general. The longer you keep them there, the better off you are.
In the retention graph below, people are dropping off dramatically right at the beginning of this live stream. So ask yourself why you aren’t holding their attention. Are you not engaging them right up front? They want to talk to you so are you not talking back to them? Find out what you can tweak in your live video to make this graph more stable.
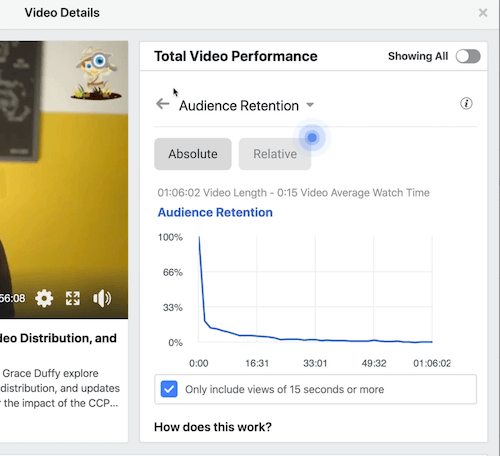
Keep in mind that your audience retention graphs are going to show some drop-offs. Every retention graph I’ve ever seen for Facebook Live video has a big drop-off right in the beginning so don’t let that discourage you.
Engagement
Instead of analyzing confusing graphs to muddle your data-driven decisions, focus more on the engagement factors like comments and reactions—the actions taken by the people watching your live video.
Here, the Post Engagement data shows that 62 people liked this Facebook Live video, 13 people loved it, and one person gave a sad face—probably because of something that was said or they accidentally hit the sad face.
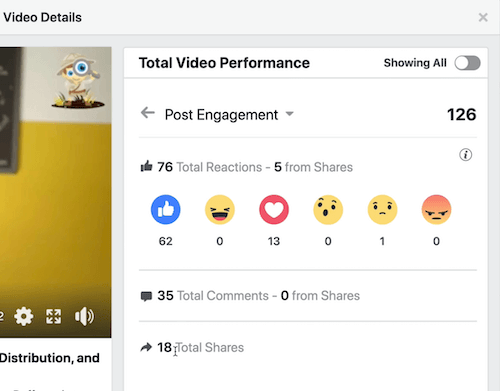
You can also see the total number of comments and shares, so if shares are important to you to get more organic traffic, ask for shares in your live streams and track how many shares you get.
Funnel Insights
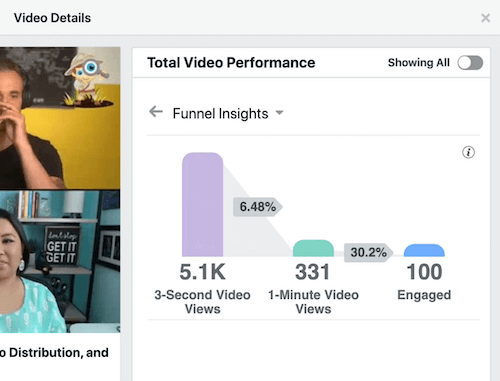
If you look at Funnel Insights, this is Facebook attempting to be helpful with 3-second and 10-second views and give you a little more understanding of how engaged your audience is. Basically, Facebook is taking the 3-second views, comparing that down to the 1-minute video views, and then looking at the engaged people. This is the number of people who commented, shared, or reacted to your live video. So if you’re looking for percentages, this is where you’ll find that data.
#3: Key Facebook Live Metrics to Watch
While all of these Facebook video insights will help you understand more about how your live video is performing, don’t make all of your decisions based on these insights in isolation. Instead, look at your data points as they relate to each other.
Analytics can be a powerful tool if interpreted correctly but they can be equally destructive if you aren’t looking at the right metrics.
For starters, don’t pay attention to the 3-second or 10-second views. Seeing that 80% of people watched for 3 seconds is not only depressing but also misleading.
A lot of factors with Facebook Live video are different from recorded video. Viewers frequently come and go during a live broadcast. Maybe they get a phone call while watching on their mobile device so it interrupts the stream. When they come back, that’s counted as a new session. While they may have been there for 3 seconds the first time, got a call, came back, and watched for 15 minutes, they’re counted differently so it’s not cumulative.
Also don’t pay attention to minutes watched unless you’re using it to compare your growth over time.
Do, however, pay attention to the ratio of engagement to viewers. If you have 100 simultaneous viewers and only 2 people commenting, that’s not a good ratio. You absolutely want more people commenting and engaging than that. If you can hit a 20% to 30% engagement rate, meaning 20% to 30% of simultaneous viewers are leaving comments, you’re doing well. If you get anything higher than that, you can consider your streams to be highly engaging.
Also pay attention to unique viewers. That’ll give you a better understanding of how many people you’re actually reaching with your Facebook Live video.
Conclusion
Let me leave you with two guiding principles to remember when analyzing your Facebook Live video insights.
First, at the end of the day, your goal with live video should be to create loyal fans for your brand. So it’s better to have 50 viewers watching with a 75% engagement rate than 100 viewers watching with a 10% engagement rate. Facebook won’t show you this data so you’ll have to use your brain on this one. However, I’m a firm believer that this metric matters more to your growth than any of the insights Facebook will give you.
Second, look at where you start, not somebody else, and work to constantly improve your metrics. You’ll see faster results this way with live video and get more creative in the process.


